
With hundreds of website metrics available, it’s easy for marketers to get lost in data. But most of these metrics are noise. Outcome-based metrics—measurable actions tied to real user behavior—cut through the clutter, showing what really drives growth.
In this blog, we’ll cover why prioritizing outcome-based metrics can help you make smarter decisions, drive growth, and actually know what’s happening on your website. And we’ll show you how you can start tracking these metrics in minutes and completely for free.
1. Users (Filtered for Bots)
What it is: Users are the number of unique visitors to your website, filtered to remove bots.
Why it’s important: Understanding how many real humans are interacting with your site helps you gauge reach and audience growth. And raw page views can be misleading if bot traffic inflates the numbers. At the end of the day, users are the most important website metric because none of the other metrics matter if no one is using your site.
How to Track It: Many analytics tools track the number of users on a site. Microsoft Clarity automatically filters out bots from your user count, giving you an accurate snapshot of your audience. Filtering out bots ensures you’re measuring real human visitors, giving you an accurate picture of audience reach and engagement.
2. Sessions
What it is: A session represents a single visit by a user, capturing all the pages they view and actions they take during that visit.
Why it’s important: Focusing on sessions rather than pageviews helps you understand real user journeys. A high session count with multiple pages per visit indicates engaged users, while sessions with little interaction may point to content or UX issues.
How to Track It: Analytics platforms like Clarity and Google Analytics automatically track the number of sessions on a site. Clarity also captures every session, generating session recordings and heatmaps that show you the user behavior behind each session.
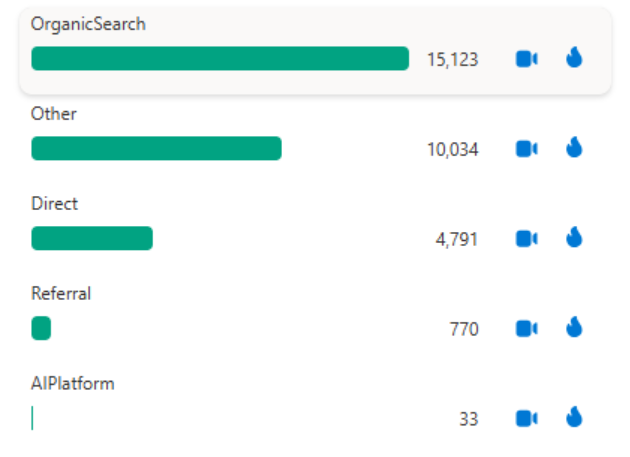
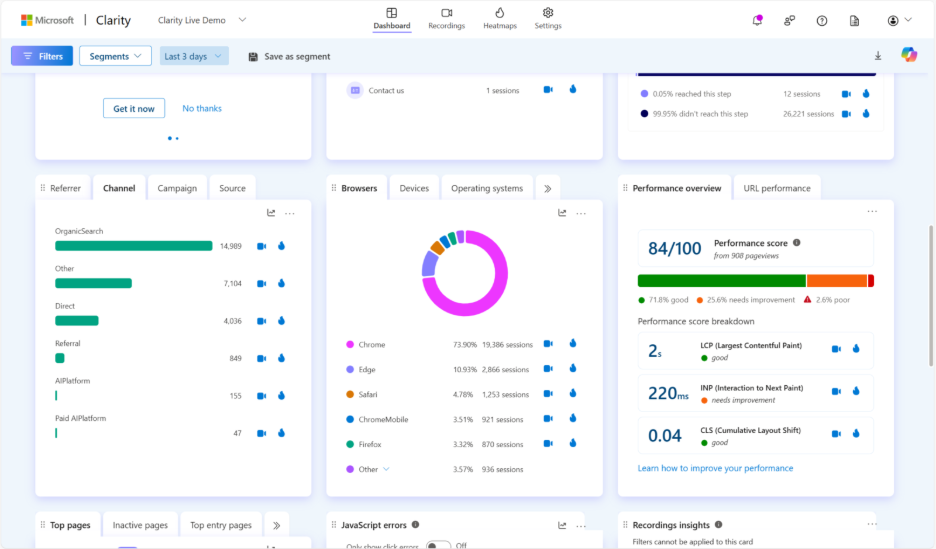
3. Traffic Channels
What it is: Traffic channels represent where your visitors are coming from. Potential channels include organic search, social media, AI platforms, paid ads , or referrals.
Why it’s important: Knowing which channels drive the most valuable traffic allows you to optimize campaigns and allocate budget wisely.
How to Track It: Most web analytics and behavior analytics tools can break down traffic by channel. That said, there is some nuance to how each platform approaches channel-based metrics. And each tool will vary in what metrics they can break down by channel, covering sessions, users, pageviews, or some combination of above.
Some platforms will have many metrics under the umbrella of channel or medium metrics. For example, Google Analytics 4 alone has 16 dimensions for breaking down multiple metrics by channel or medium. In contrast, Clarity has one straightforward view for breaking down sessions by channel.
Taking this into account, there are potentially dozens of ways to go about measuring how specific channels drive traffic to your site. Each marketing team will need to carefully decide which approach to attribution is right for them.
4. AI Referrals
What it is: Visitors who arrive at your site from AI platforms like ChatGPT, Claude, Gemini, Copilot, or Perplexity. Unlike traditional search users, AI-referred visitors often skip your homepage and land directly on deeper content pages. They also tend to come with higher intent, making them a valuable group to understand.
Why it’s important: Analysts predict traditional search volume will drop by 25% by 2026 as AI chat tools become a primary gateway to the web. For marketers, that means two things: (1) AI referrals are likely to represent a growing share of traffic, and (2) the way these visitors interact—arriving deeper in the funnel and converting at higher rates—requires a different approach to measurement and optimization.
How to Track It: Most analytics platforms allow you to track AI referrals, usually by analyzing referral sources or filtering channel data. Microsoft Clarity goes a step further by automatically separating this traffic into two groups: AI Platform (organic visits from AI chat tools) and Paid AI Platform (ad-driven visits within AI experiences). This breakdown makes it easier to compare performance across organic and paid AI channels without additional setup.
5. Conversions by Channel
What it is: The number of desired actions (sign-ups, purchases, downloads) completed per traffic source.
Why it’s important: Conversions are one of the most vital metrics you can measure on your website. A conversion is the first step an anonymous user takes to becoming a named lead and eventually a customer.
But knowing how many conversions you have isn’t enough. To build an efficient and effective lead generation engine, you’ll need to attribute conversions to specific channels. This lets you know which channels are the most effective at driving you users that convert, which helps you double down on the channels that are working and fix or divest from the ones that aren’t.
How to Track It: Analytics platforms like Microsoft Clarity, Google Analytics, and Adobe Analytics let you define “conversion events” (form fills, purchases, signups, etc.). These events are then tied back to traffic channels (organic, paid, social, referral, email, AI, etc.). UTM parameters can strengthen this by labeling traffic from specific campaigns, sources, and mediums, so conversions can be attributed with more precision. These tools will come with out-of-the-box channel reports, are easy to set up, and some options are even free.
For teams looking to go deeper in the marketing funnel, integrating CRM systems, marketing automation, or revenue analytics platforms enables attribution down to leads, pipeline, and revenue. This advanced approach offers granular insights but comes with added complexity and cost, making it suitable only for teams ready to manage the investment.
6. Bounce Rate
What it is: The percentage of visitors who leave your site after viewing only one page.
Why it’s important: A high bounce rate can indicate poor user experience, irrelevant content, or slow-loading pages. Conversely, a very low bounce rate can be a signal that the tracking for your analytics tools isn’t set up properly.
How to Track It: Bounce rate is typically tracked in tools like Google Analytics or Adobe Analytics, where it’s calculated automatically based on single-page sessions. Microsoft Clarity doesn’t measure bounce rate directly, but it gives you related behavioral insights—like average scroll depth, engagement heatmaps, and session recordings—that help you understand why visitors leave. In practice, many marketers use a combination: GA for the bounce rate percentage, and Clarity to diagnose what’s driving it.
7. Average Scroll Depth
What it is: How far users scroll down a page on average.
Why it’s important: Scroll depth is a strong indicator of content engagement. A low scroll depth indicates a pages needs improvements like stronger calls-to-action, better readability, or improved content placement.
How to Track It: Behavior analytics tools automatically measure scroll depth across all pages, helping you see which content keeps users engaged.
8. Organic Clicks
What it is: The number of times users actually click through from a search engine results page (SERP) to your website. Unlike impressions—which measure how often your page appeared in results—clicks reflect real traffic delivered to your site.
Why it’s important: Organic clicks are a true outcome-based metric. Impressions or average keyword rankings can look impressive, but they don’t always translate to site visits or conversions. Clicks show you whether your SEO efforts are generating tangible results. More clicks mean more opportunities to convert visitors into leads or customers.
How to Track It: Organic clicks are best tracked with a combination Google Search Console or Bing Webmaster Tools, which provide direct reporting from the search engines themselves. In your analytics platform (Google Analytics, Adobe, or Microsoft Clarity), you’ll see this traffic reflected under the organic search channel, where you can measure how those visitors behave once they land on your site—things like sessions, conversions, and engagement. This two-step view (Search Console for clicks + analytics for behavior) gives you both the volume and the quality of your organic traffic.
9. Average Cost Per Acquisition (CPA)
What it is: The average amount you spend to acquire a single customer or lead. It’s calculated by dividing your total marketing spend by the number of conversions generated during a specific period.
Why it’s important: CPA is a true outcome-based metric that directly links spend to results. CPA tells you whether your marketing investments are efficient and sustainable. Keeping an eye on CPA helps you optimize budgets, prioritize channels, run cost-effective campaigns, and drive profitability.
How to track it: Most analytics and advertising platforms provide CPA calculations automatically. Google Ads, Microsoft Ads, Meta Ads Manager, LinkedIn Campaign Manager, and other ad platforms will show CPA per campaign or channel. But CPA isn’t limited to paid—it can also be calculated for organic, referral, or AI-driven traffic by dividing costs (like content production, SEO investment, or agency fees) by the number of conversions those channels generate. For a broader, cross-channel view, you can calculate CPA in your CRM or marketing analytics platform by combining total spend with conversions tracked via UTMs or integrated analytics.
Pro tip: Behavioral analytics tools like Microsoft Clarity can integrate directly with Microsoft Ads and Google Ads, letting you connect cost and behavioral data in one place. This makes it easier to see not just how much you’re spending per acquisition, but also how those visitors engage with your site once they arrive.
10. Performance Score & Core Web Vitals
What it is: A set of metrics that measure the speed, responsiveness, and visual stability of your site—commonly including Largest Contentful Paint (LCP), First Input Delay (FID), and Cumulative Layout Shift (CLS). While it’s technically multiple metrics, they combine into a performance score that reflects the overall user experience.
Why it’s important: Fast, stable, and responsive websites keep users engaged, improve SEO rankings, and increase conversion rates. One study found that websites that load in 1 second have a conversion rate 3x higher than sites that load in 5 seconds and 5x higher than those that load in 10 seconds. Conversely, slow or janky experiences can lead to higher bounce rates and lost conversions.
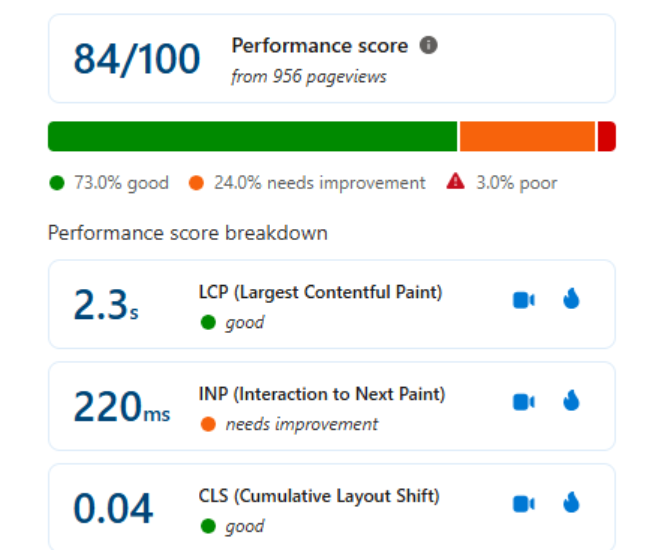
How to Track It: Tools like Google Lighthouse provide detailed performance scores. Something to be aware of if that evaluating multiple pages entails either running reports page by page (and reports are slow to load) or automating the process through continuous integration or the command line interface. Alternatively, Microsoft Clarity automatically aggregates performance data across all pages on a domain or directory, giving you a holistic view of web performance at a glance.
Conclusion: Focus on What Matters
Focusing on the right metrics can transform how you understand and grow your website. Outcome-based metrics—like organic clicks, conversions by channel, and average cost per acquisition—give you clear insight into what’s actually driving results, rather than just showing surface-level activity. By tracking these measures consistently, you can make smarter decisions, optimize your marketing spend, and ultimately create experiences that lead to meaningful engagement and revenue.
Track what truly matters—start using Microsoft Clarity for free and turn your website data into actionable insights today.